
Shannon's Demon Explainer
Everything you wanted to know about Shannon’s Demon - mathematical concept turned bedrock investing principle. Bit of a long post, I’m afraid, but it’s important!

To help you navigate: First part is the basics, written for those new to the topic. Second, some demonstrations of it in action since Shannon’s Demon can be a little difficult in the abstract. In part three, I suggest some ways investors can take advantage of it, and then in part four, I address some possible questions, including where one can learn more . Also - don’t miss the accompanying YouTube video.
Part 1: The Basics
Shannon’s Demon is a mathematical concept applied to investing in which uncorrelated assets, when strategically rebalanced, will form a portfolio that can generate more long-term growth than either asset on its own. Such a portfolio will be more stable, have greater risk-adjusted returns and may have higher total returns than the assets considered individually. Essentially, Shannon’s Demon explains how the whole (the strategically rebalanced portfolio of uncorrelated assets) is better than the average of its parts. It’s a foundational concept for portfolio construction, and especially important for explaining Risk Parity.
If that sounds vague, or a bit too good to be true, some examples that I run through later should help illustrate the points.
The ideas behind it come from Claude Shannon, mathematician, computer scientist, cryptographer and one of the big geniuses of the twentieth century (btw, you wouldn’t be exaggerating if you dropped the “in the twentieth century” qualifier). The “demon” comes from an original problem of “Maxwell’s Demon” in thermodynamics which Shannon responded to and applied to mathematics. Interestingly, “Shannon’s Demon” in terms of investing was never the subject in a formal paper by Shannon, and our knowledge of his thoughts comes from lecture notes and snippets.
Shannon was interested in investing and originally proposed a coin flip experiment “game” where flipping heads would result in a +50% gain, while tails would bring a -33.3̅% loss (for the other non-math people, these are actually balanced and you back to the starting point after one heads and one tails, no matter which one is first). I will go through the experiment methodically, but the expected outcome if you don’t rebalance is 0% return over whatever number of flips you like.
Shannon’s insight is that you can eke out a return with a simple change. If you add in cash, another asset whose returns is also 0%, you can eke out an expected positive return over whatever number of flips you like. The expected number depends on the pattern of flips that comes up, but even without any loaded coin, you have turned two assets who each have 0% expected return into a portfolio with a positive expected return.
This is a mathematical pattern for asset performance in a portfolio, as long as that portfolio meets certain requirements, as I will go over in greater depth below. First off, the assets in the portfolio need to be at least somewhat non-correlated, and the effect will greatest with assets that are dissimilar from each other. Second, you have to rebalance between the assets. If you don’t, then you do just get returns from the portfolio which are just proportional to the returns of the assets within them. Third, transaction costs will detract from the effect, though this isn’t such a big deal anymore in these days of free trading.
Part 2: Illustrating Shannon’s Demon
Admittedly, Shannon’s Demon is a bit of a tough concept to grasp without an example. It can also be suspicious to some, as the basic tenet is that you can create a positive return even out of assets that each have 0% total return.
For me, seeing Shannon’s Demon in action helped me wrapped my head around it - so here are two scenarios to look at:
In Scenario 1, I’ll walk you through Shannon’s original coin flip game which will show you how the concept works in the abstract.
In Scenario 2, I’ll use two actual assets: SPY to represent the stock market, and GLD to represent gold, over a 21-year time frame, to illustrate a simple real-world example: LINK here
Scenario 1: The simple coin flip game
Simple set-up: the “house” uses a fair, unbiased coin. You put your money in before the flip - if it comes up heads, you multiply the amount bet by 1.5 and the house gives you your winnings. If it comes up tails, then you divide your staked amount by 1.5, with the house taking the difference. In our baseline example, you put your entire stake (let’s say $100 initially) into the game before the first flip, then just let it ride either way.
I simulated ten rounds, with five wins and five losses and mixed them up a bit for effect. Starting with $100, I wound up after ten flips with…no surprise…$100. Here is how the game went in these ten rounds:
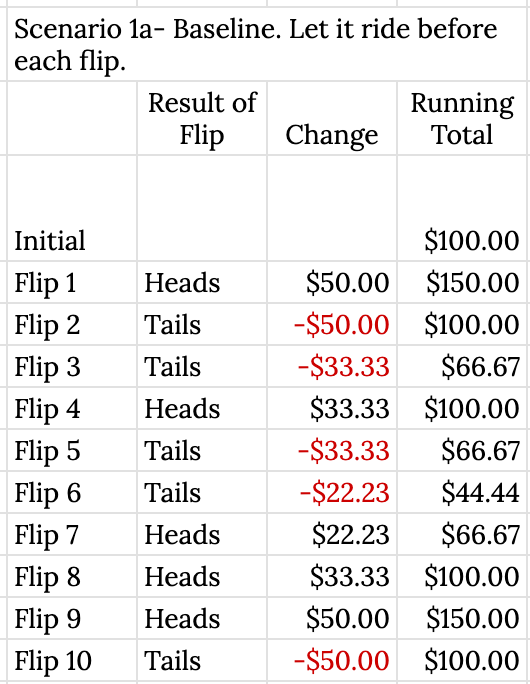
Obviously, not every game of ten flips is going to have 5 heads and 5 tails, but you can see that the more flips you have, the more it would trend towards 0% return, even with some variation. Here, courtesy of Richmond Quantitative Advisors, is a graph showing the performance of 100 simulated games, each with 1000 flips. You can see some games are a success and some are failures, but in about equal numbers, as the results cluster around 0%.
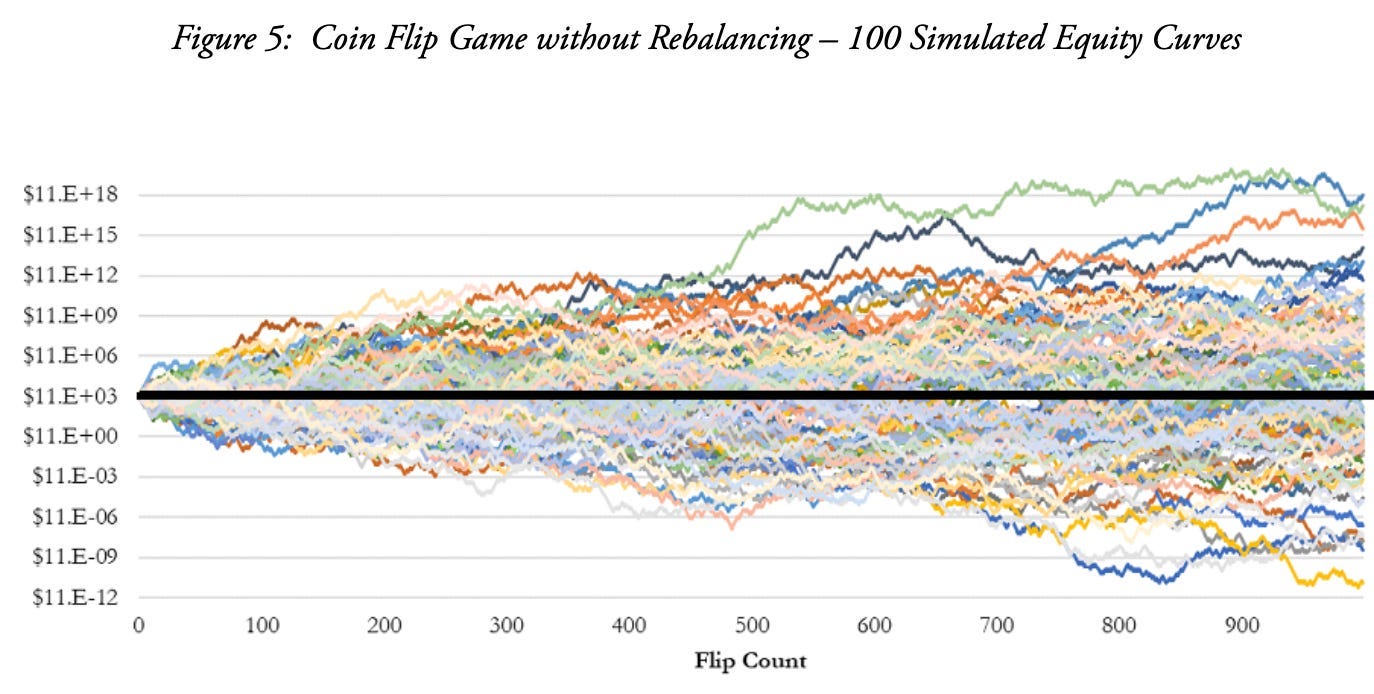
Regardless of how many times you play, you can expect to essentially hover around 0%. No big deal, and probably this “game” would just be a waste of your time.
Shannon’s insight was that if you approach the game a little differently, you can wind up with expected returns greater than 0%, even if the thing you do differently also promises no return on its own. Simply put, the strategy is to put half your money in the game and keep half in cash, where it will neither gain nor lose value, each turn. You then rebalance after each flip. To reiterate: the cash reserve has the same 0% expected return as the coin flip. Shouldn’t the expected return of two 0% assets also be 0%?
No, because they are non-correlated and there is systematic rebalancing between them. You actually create a positive expected return by sequestering half your money like this, in a process akin to magic.
For this example, I’ll also show ten coin flips and that the results are the same as the baseline example.
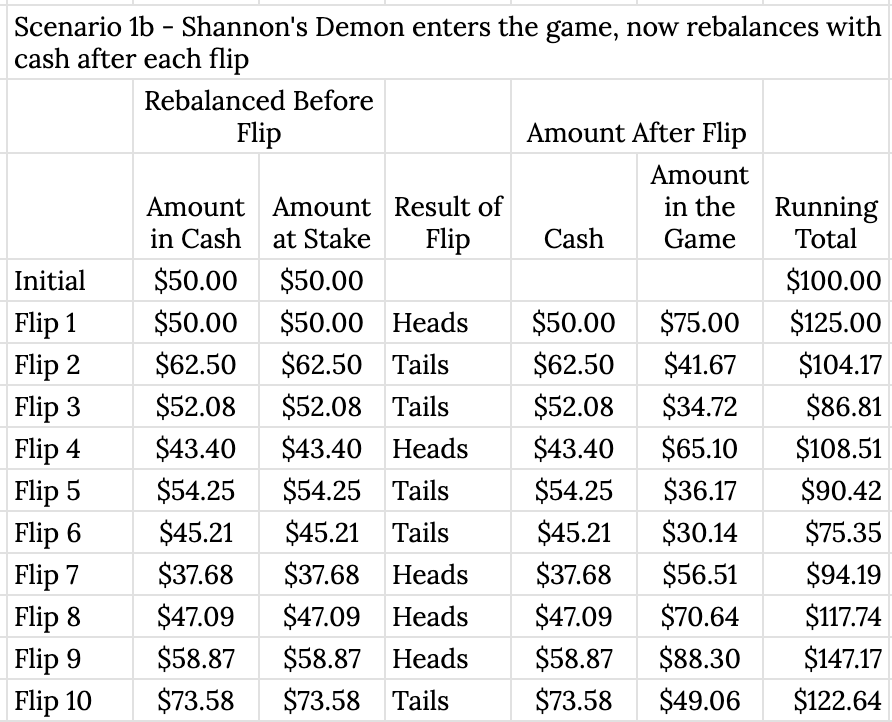
Made $22.64! That’s from two assets, each of which by itself returns 0%, and given an equal number of wins and losses. In case you’re curious, you could reverse the results of each flip, and you wind up with the same 22.64% after ten flips.
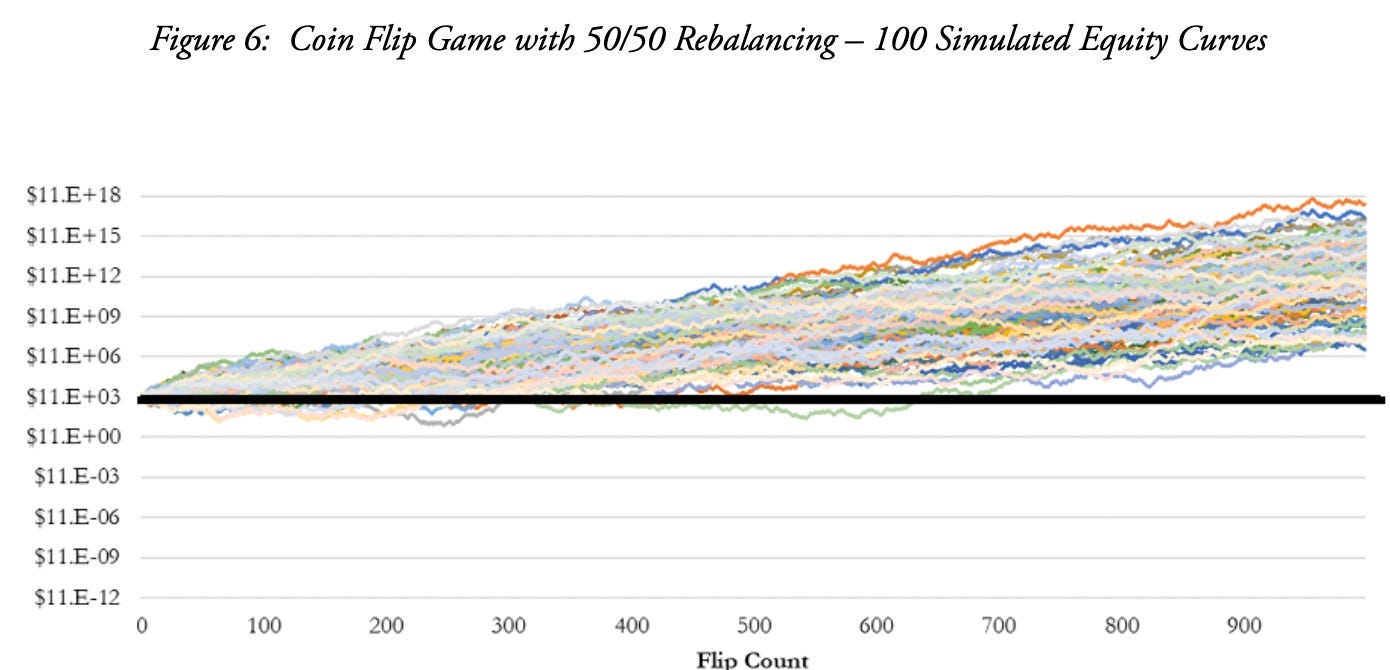
To return to the graphics in the article from Richmond Quantitative Advisors, you can see that in 100 games played using the Shannon strategy, all finished above 0% as soon as you got to about 700 flips, with most positive long before that.
Not really magic. Just math.
Scenario 2: A Real Two-Fund Portfolio over the Past 21 years
Find and dandy in the abstract, but has it worked in the real world? You betcha, though depending on the assets you choose and the timeframe, the results are not always so strong as before. In this case, I’ll use two assets whose returns are fairly uncorrelated to each other: the US stock market (represented by the ETF “SPY”) and gold (in the form of “GLD”). Given the age of GLD, I can take the back test all the way back to December 1, 2004. For those curious, the correlation between the two over the period was .07, meaning their patterns of returns essentially had no connection to each other.
During the 21-year period, the individual performances of SPY and GLD are as follows:
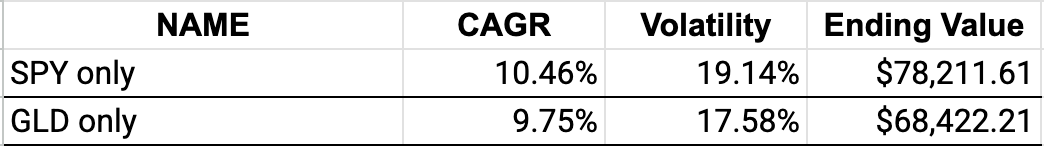
Both have performed well over the past two decades, so a little different than our last example where both returned 0%.
To test, our baseline example will be to hold both assets in a 50/50 split, but not rebalance between them. Since we have equal parts of stocks and gold, our portfolio’s returns will essentially be the mid-point between the two assets. Our total volatility will improve, as well. The 50/50 split of SPY and GLD that is not rebalanced looks like this:
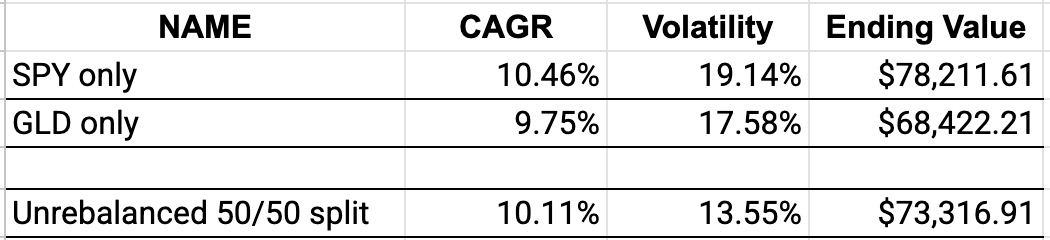
Returns are as expected and the portfolio is better in terms of the volatility.
But what if we now bring in Shannon’s ideas, and rebalance between the two assets at monthly intervals? The concept of Shannon’s Demon tells we’ll get a less volatile portfolio (that is, below 13.55%), and should get a compounded annual growth rate higher than 10.11%. Basically, will the rebalanced whole be better than the sum of its parts?
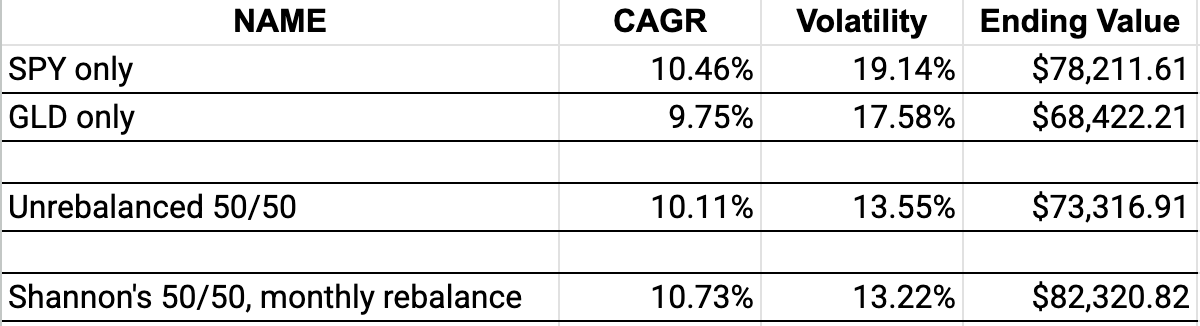
Yep. What’s even more interesting here is that not only is the portfolio better than the un-rebalanced 50/50 split, the Shannon’s Demon version is better than EITHER ASSET WAS ON ITS OWN. The portfolio had a higher return than SPY or GLD, and lower volatility overall. This was the version of monthly rebalancing - you can see the weekly rebalancing version was even better, though the semi-annual version was slightly worse, though still directionally the same compared to the baseline versions. By the way, with those links above you can play around with the parameters and see for yourself.
Part 3: Working With Shannon’s Demon, especially in the Risk Parity portfolio
At this point, the basics of Shannon’s Demon should be clear, and I’ve shown two examples of it in action. But the real question is - so what? What are the implications for the DIY investor, especially in terms of Risk Parity?
Simply put, Shannon’s Demon is the core reason behind why Risk Parity portfolios are more stable than traditional ones, and well suited for decumulation portfolios when that stability is as important than total return. Shannon’s Demon is a way of operationalizing the adage “Buy Low, Sell High,” since the rebalancing scheme is what forces that discipline on an investor.
How can the individual investor put these ideas into practice to create more stable portfolios, and maybe more profitable ones, too?
First off, create portfolios of uncorrelated assets. To take advantage of Shannon’s Demon, you might need even greater uniqueness among your assets than you think. The “Holy Grail” for Risk Parity investing is 15 to 20 good, uncorrelated assets, and even though I don’t think it is realistic to find this many as a DIY investor, it is relatively easy and inexpensive to construct good portfolios out of five: equities, Treasuries, multi-asset trend-following, long-only gold, and cash equivalents.
Within these categories, be sure to look at the correlation numbers to see whether the assets are as uncorrelated as you think. Many people will say they hold US stocks and international stocks since they are “uncorrelated,” but a glance at the numbers shows they really aren’t. There are lots of good reasons to hold international equities, and I do, but you don’t get much impact from Shannon’s Demon with them, as their correlations to each other generally fall from .8 to .9. On the bond side, some people might hold corporate bonds to diversify away from Treasury bonds, but then you wind up with bonds that creep very close to equities, and true diversification benefits are lost.
To check the correlations of assets, use the asset correlation tool on Portfolio Visualizer. The numbers will range between 1 and -1, and the lower the number, the less correlated two assets are. Finding assets with a negative number to each other is ideal, but rare. Numbers around zero are great too. For positive numbers, if something is reliably at .5 or lower, then it has my attention, at least. One note of caution - these correlations are not laws of the universe, and can change. Long-term Treasuries and equities have typically been uncorrelated for most of the past forty years, but definitely were not in 2022, much to the consternation of lots of investors (like me!).
Second, you need to set up a rebalancing schedule, and once set up, you’ll need to stick to it. One simple way is just calendar based. Most people will want to look at their investment accounts around the new year to put any dividends back into action, so that can be a date, then maybe two or three events throughout the year (tax time? birthdays?). Since I’m a teacher, my pattern for a long-time used to be at the end of winter break, during spring break, at the end of summer break, and then at my birthday (November).
The question of what frequency of rebalancing is best has been a big question for researchers, and so far, it appears that the best answer is the typical one…it depends. Rebalance too often and you may not be letting your winners run enough, and not buying as many assets when they are really in the depths of their struggles. Rebalance not often enough, and you may not capture movements - instead just having things move up and down without taking advantage. If you’re looking for a general guide, I’d say at least once a year, and then maybe five times a year maximum.
But calendar based rebalancing is, in my opinion, inferior to the more systematic approach of threshold rebalancing (see this Michael Kitces paper for more). Simply put, this is a technique where a rebalancing event is initiated once your actual allocations drift too far away from your target allocation. For instance, if I set a relative threshold of 20% in my 50/50 SPY & GLD portfolio, I would rebalance if either asset gets to 60% of the portfolio. If you have a portfolio with multiple assets at different allocation, say a Golden Ratio portfolio, then the threshold rules are still easy to follow. Gold, which has a 16% target, would need to be rebalanced if it ever climbs to 19.2% or 12.8% as those numbers represent plus and minus 20% differences from target.
To see if those thresholds have been crossed, you would need to check your portfolio more frequently. Once a month is good, perhaps when your 401k contributions arrive or something like that. You can quickly see if anything is beyond its range, and then rebalance if needed. At a threshold of 20%, I find you don’t need to rebalance very often - maybe once or twice a year. Threshold rebalancing is still not perfect - as you may still be rebalancing before an asset has finished its upward trend, but it will tend to more reliably capture the big asset moves, and is not a whole lot more time-consuming as an approach.
Part 4: Some Hypothetical Questions Answered
I’m in the Accumulation Phase of investing - do I need to worry too much about Shannon’s Demon?
Nope, not really. If you’re in the accumulation phase, then the stability offered through rebalancing between uncorrelated assets in a portfolio is of secondary importance. Total return is of primary importance, so really, you can go 100% equities and just let them go, if you can stomach that level of volatility.
Is it okay to invest in individual stocks as part of portfolios trying to maximize Shannon’s Demon?
I would keep individual stocks either out of such a portfolio all together, or else bunch them up with other individual stocks or ETFs within an asset class. The logic behind Shannon’s Demon assumes mean reversion at some point, more or less, but if you are considering individual stocks, then you can’t really assume that. If Enron were in your portfolio as its own line item, then you just would have kept pouring money into it all the way down. If you have an individual holding now, like Google, then I’d either not count it at all or bundle it with US core or US large-cap equities.
Does Shannon’s Demon always work?
Well, yes, and no. Yes - it’s math, so if the conditions and caveats are all in place, then theoretically, it will. But the caveats are important, and this is where portfolios may not take advantage of Shannon’s Demon. As mentioned, most assets are more correlated than people assume, and you really don’t get much of a rebalancing effect when assets are similar. These correlations are not laws of the universe, and if they change, then you’ll find your demon has stopped demon-ing. Second, people often don’t rebalance, and so don’t take advantage of big moves in the assets that make up a portfolio. It's also easy to talk yourself out of rebalancing - when an asset has gone up 25% in a year, it’s easy to just let it keep going, and people can justify holding off on selling at that time. Likewise, if an asset plunges 25%, it's more likely that an investor will consider getting out totally as opposed to buying more. The rules of rebalancing, if followed, can make investor behavior better, by forcing you to sell high or buy low, but this is easier said than done.
Where can I learn more?
Compared to other crucial investing concepts, like passive vs. active, or the (un)importance of dividends, there is not much out there on Shannon’s Demon. In my research, this explainer from Richmond Quantitative Advisors was very helpful. It has a walk-through of Shannon’s coin flip game simulation, which I adapted here. Here also is a Portfolio Charts article on Shannon’s Demon and Rebalancing that was also informative. This article from Adam Butler at GestaltU was a third excellent source. Finally, in terms of written explanations, this piece from the blog Beating the Market was also quite good, and has a few embedded links which may be fruitful to follow up on.
When Shannon’s Demon pops up on YouTube, it tends to be for an audience of day traders, such as this video explaining Shannon’s Demon and applying it to trading strategies from Zero Day Mark. Beyond that, not much is helpful (hence this post!), though if you do search for a related concept, the Kelly Criterion, you’ll find a lot more, such as this by Financial Wisdom. Also stumbled upon this gem that applies Shannon’s Demon to farming. It has no sound, but demonstrates the concepts well.
For podcasts, it comes up regularly on Risk Parity Radio, such as in episode #330 or here in episode #426. There is also this interview of Tyler from Portfolio Charts on the podcast Security Analysis hosted by the Value Stock Geek. It’s contains a thorough explanation of how and why Shannon’s Demon works.
If you have any questions about Shannon’s Demon, let me know!
Fantastic article on a key concept! Building on that, when you combine uncorrelated assets within a return stacked fund, you get the rebalancing premium this article describes AND capital efficiency — both significant structural advantages that can generate excess returns. Another benefit to having this diversification within a fund is behavioral — the individual assets can be quite volatile, but since the fund is constantly doing the rebalancing for you, at the fund level, you experience a smoother ride, reducing panic selling. Thank you detailing this important phenomenon.
Great article. I appreciate how you clarify the mechanism of rebalancing and the importance of uncorrelated assets to make it function. Thank you for your work.