
Sizing your Bond Allocation
It is now winter break, so have some more free time for a good old fashioned Risk Parity Chronicles Quest. This time, wondering about bonds: how much of one type do you need to match another?

Back in the old blog days, I used to get pretty excited for multi-part quests. I would have some question, then do a deep dive to satisfy my own curiosity, and then would share findings the best I could. They do take some time, though, but luckily this nice winter break we teachers get has given me time to take on a long-standing question: how do I size bond allocations effectively, so that I can use less of a more volatile bond to match the portfolio performance of a less volatile one? The thing about volatility is that it gives me more bang for the buck, or the same bang for fewer bucks, as the case may be.
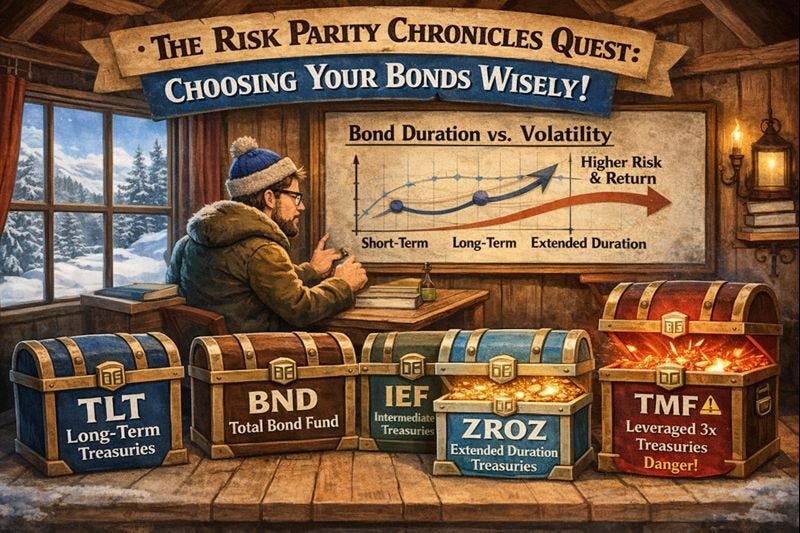
Unlike equities, where there is not a smooth trade-off between volatility and return, fixed income has a pretty clear pattern. Separating credit risk aside for the moment, if you use mostly US government Treasuries, you can use different durations of bonds to prioritize stability or return. Duration is the measure of a bond’s sensitivity to interest rate changes: the longer the duration, the more the bond’s volatility and expected return.
To put this in real terms, say, for example, that you have decided on the Golden Ratio portfolio, and you have 16% devoted to TLT (iShares Long-Term Treasuries ETF). But, you’ve also heard that GOVZ, iShares Treasury STRIPS ETF, is like TLT but more volatile and with slightly higher expected return over longer time periods. You could replace TLT with GOVZ in the same amounts, and get the added return if you accept the bumpier ride for that portion of your portfolio. Incidentally, this doesn’t necessarily mean a bumpier ride for your portfolio as a whole. Through the magic of Shannon’s Demon, more volatile assets can actually make your portfolio less volatile if those assets are even less correlated to the other drivers in your portfolio.
Another approach to using more volatile assets is that you can hold fewer of them, and then allocate the portion you saved to another asset class. Want to make room for trend-following managed futures in a portfolio? Drop that 16% you had in TLT to some smaller number in the more volatile GOVZ, and use the difference for DBMF, perhaps.
But what’s that number? A ha! That’s my question.
I realize my tendency is to make my posts too long, so here is the TL;DR version, and then I’ll explain how I came up with it after:
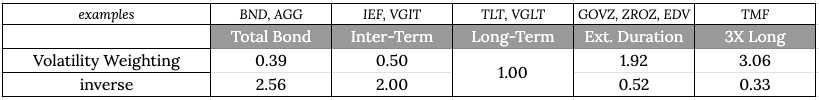
This table is based on Long-Term Treasuries as the baseline of what you are comparing to, though I have run the tests for other bond funds and you can find the results below. BTW, the top number is how much of Long-Term bonds you’d need to replicate the volatility of the other bonds; the bottom number is how much of the other bonds you’d need to replicate the volatility of Long-Term bonds.
Still reading? Sweet!
The math is straight-forward: just size them based on volatility, with larger positions of more stable investments and smaller positions of more volatile ones. The data set would be key. Bonds tend to have long trends one way or the other, and I wanted a data set that would contain multiple instances of those. Thanks to the handy feature of simulated assets on Testfol.io, I was able to get data back to 1986 and satisfy my search for data with multiple trends within it.
The Assets Tested
First off, I need to define the sand box: what exactly are we trying to compare, and what are we comparing them to? While some may use a Total Bond fund or even just Intermediate-term Bonds as their “baseline” holding for bonds, it is more common in the Risk Parity world to use Long-Term Treasuries as the standard asset for bond allocations. In terms of particular tickers. TLT and VGLT, the Long-Term Treasury ETFs from iShares and Vanguard, respectively, are the two most popular LT Treasury funds and what I’ll focus on here.
With LT Treasuries as the baseline, we can then compare other types of bond funds to it:
AGG is the industry standard for a bond fund, and combined with its Vanguard imitator, BND, is what most people would use in a vanilla 60/40. But AGG/BND both have corporate bonds in them and are fairly discretionary - the bond world is huge, and choices must be made.
IEF, iShares Intermediate-Term Treasury fund, along with the Vanguard equivalent, VGIT, have durations similar to AGG/BND but without the corporates and are a bit more systematic. With only Treasury-exposure, you’re minimizing credit risk and just getting the pure expression of interest-rate risk in the middle part of the curve.
My personal choice for fixed income are the extended duration Treasuries, which have longer durations than even Long-Term Treasuries. Longer duration means more volatile, deeper drawdowns and higher likelihood of ulcers, but do typically have higher returns compared to LTs. By the way, these have various names. I like to call them Extended Duration, since that makes logical sense - you are extended the duration of even Long-Term bonds. But technically, these are known as STRIPS, which stands for Separate Trading of Registered Interest and Principal of Securities, and means that the interest portion of the return stream of these bonds is “stripped” off and sold away, leaving only the return of capital at the end of the term. Because there are no interest coupons to collect (hence another name - “Zero Coupon” bonds), the purchase price is lower than face value. with the proceeds from those are set off against the cost of the bond. GOVZ is my favorite of these funds, but it is the youngest (only to 2020), so I’ll use data from two others which go back to 2007 (EDV) and 2009 (ZROZ).
Not even a 25+ year duration is enough for some people, so we have, TMF a 3X levered long-term Treasury fund. I hold TMF in real life, and let’s just say it hasn’t been fun. I got it in 2021, just before the biggest bear market in recent history, and TMF has been a disaster. Still, it will be interesting to see how the numbers shake out.
The Tests
Lots of algebra in this one, all done with the help of Google Sheets. Boring to talk about, so here is the sheet.
The Basics tab just shows the performance of the assets I looked at, both since 1986 and since 2009. I used only data since 1986 in my calculations, but am including the other data since I assembled it and thought I might as well.
The Comparing tab just has the calculations of the proportions between Long-Term Treasuries and the other bond funds. Initially, I just did volatility, but in the process of then running those numbers through actual backtests, found that equalizing for CAGR made more sense for the total bond funds and Intermediate-Term Treasuries. You can see there the table shown above, plus tables for the proportions if you use the other three type of bonds as your baseline, instead.
The Confirmation Tab is where I checked my work, running those different assets at different proportions to see how they would have done in the sample period. I included links to the backtests if you want to play around with them, as well.
Discussion
One thing that jumps out is that if you try to use TLT to replicate the performance of both BND and IEF in terms of volatility, you actually get lower expected return. However, you have to keep in mind that in order to match BND, you can use 39% in TLT and 61% in cash, but with that 61%, you don’t actually have to invest it in cash. Depending on your goals, you could put that back into equities, managed futures, gold or whatever.
As part of writing this, I did about a hundred backtests. I’m not including them all here, but as a general rule, just about every variation I tested was better with extended duration Treasuries compared to anything else. You’d think this would be just in terms of total return, but when put in combination with other assets, lower amounts of extended duration STRIPS meant lower total volatility, drawdowns and ulcer index numbers, too.
I wanted to see these proportions in action, so I ran a test of five versions of the Golden Butterfly portfolio: the original with TLT, and then versions with BND, IEF and ZROZ in place of TLT, and finally one with ZROZ but volatility weighted to match TLT’s volatility. They all came out about the same, to be honest, but the best performer would seem to be with the full allocation to ZROZ. Had the highest return while remaining in the ballpark in terms of volatility, max. drawdown and the ulcer index. One could argue, though, that the last one was the best - it has a 9.6% additional allocation to cash, and one could employ this more wisely, say in managed futures, other equities or something else.
Stay away from TMF. Stay far, far, far away.
Do you worry about fiscal dominance and the potential affect on bond yields? Is dynamic allocation something you ever consider? Or is it all noise and a crystal balling?
Haha TMF has been disappointing to say the least. Enjoy the write-up👍